Quick answer
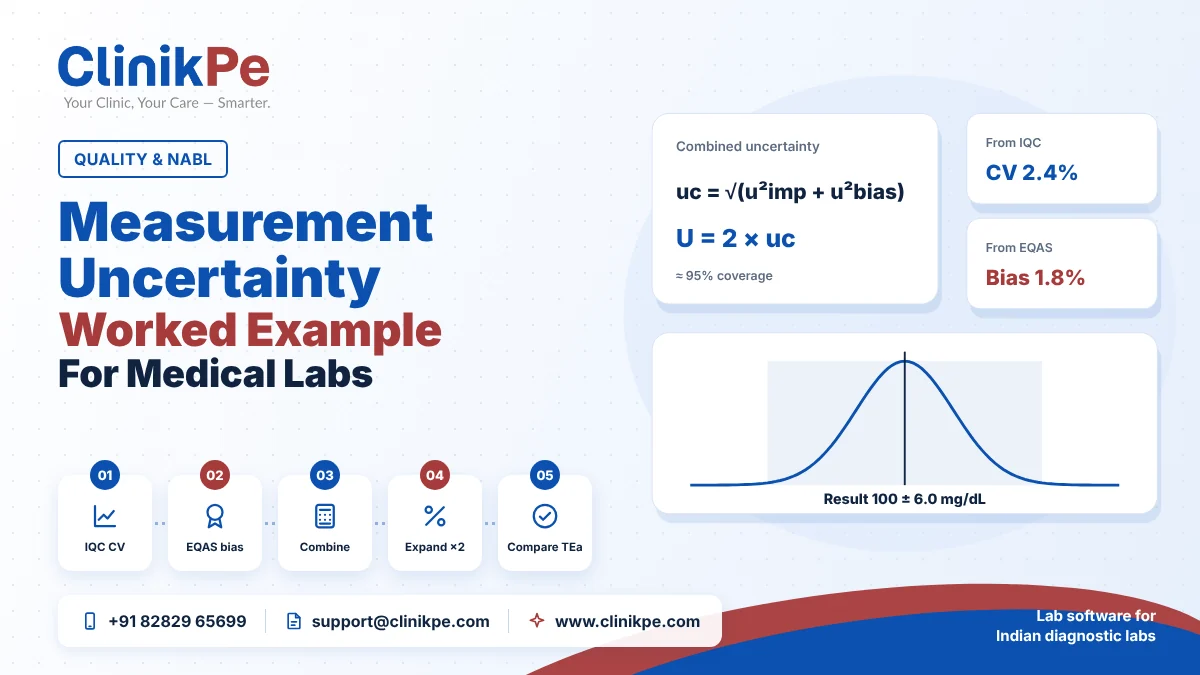
Measurement uncertainty is the range around a result where the true value very likely lies. Most medical labs calculate it top-down: combine long-term QC imprecision with bias uncertainty, u(c) = √(u(imp)² + u(bias)²), then expand it, U = 2 × u(c). ISO 15189:2022 requires it for every quantitative test, compared with a target and reviewed regularly.
Key takeaways
- MU is the ± range around a result, usually at about 95% confidence.
- Top-down MU combines QC imprecision and bias, then multiplies by 2.
- 2 × CV is a shortcut that ignores bias.
- Compare MU with a target such as biological variation or CLIA/RiliBÄK limits.
- ISO 15189:2022 clause 7.3.4 requires MU, comparison and regular review.
What measurement uncertainty is
Every result has some doubt attached. A creatinine of 1.64 mg/dL doesn’t mean exactly 1.64; it means the true value is very likely within a small range around it. Measurement uncertainty (MU) is the size of that range.
It matters for decisions near a cut-off. If an HbA1c of 6.4% has an uncertainty of ±0.3%, a doctor should know the patient could be on either side of the 6.5% diabetes threshold.
ISO 15189:2022 clause 7.3.4 requires labs to evaluate MU for every quantitative test, compare it with performance specifications, review it regularly, and make it available to users on request. Indian labs commonly calculate it from internal QC data for NABL, and assessors check that it exists, is compared with a target and is reviewed.
The top-down method in four steps
Most medical labs use the “top-down” approach, which takes the data you already collect from QC and EQAS:
- Imprecision, u(imp): the long-term CV of your internal QC, ideally pooled from at least two levels over six months or more.
- Bias uncertainty, u(bias): from a reference material or your EQAS results. Include it if your bias is significant.
- Combine: u(c) = √(u(imp)² + u(bias)²).
- Expand: U = 2 × u(c), which covers about 95% of the possible values.
Report it as result ± U, for example 1.64 ± 0.10 mg/dL.
Worked example: creatinine
| Step | Value |
|---|---|
| QC level 1 CV (n = 200) | 2.62% |
| QC level 2 CV (n = 200) | 2.99% |
| Pooled imprecision, u(imp) | 2.81% |
| Bias uncertainty, u(bias), from a reference material | 1.25% |
| Combined, u(c) = √(2.81² + 1.25²) | 3.08% |
| Expanded, U = 2 × u(c) | 6.15% |
So a creatinine of 1.64 mg/dL is reported as about 1.64 ± 0.10 mg/dL. Try your own numbers:
Measurement uncertainty calculator
Example values are from a published creatinine worked example (Singapore Accreditation Council, 2025). Enter your own long-term QC CVs and bias uncertainty.
Combined, u(c)
3.08%
Expanded, U (k = 2)
6.15%
Report as
1.64 ± 0.10
Within your allowed uncertainty of 8%.
Is your uncertainty acceptable?
MU only means something compared with a target. Common sources of targets are:
- Biological variation specifications (the EFLM database)
- Allowable total error limits from CLIA or the German RiliBÄK guidelines
- Clinical needs agreed with the doctors you serve
A Spanish study reported glucose with U of 4.98% against an allowed maximum of 11.0%. A Delhi study at GIPMER found all 26 analytes met the RiliBÄK limits, but albumin, calcium and sodium failed the tighter CLIA 2019 and biological-variation targets. The tighter your target, the more your imprecision matters.
What NABL assessors check
- MU is evaluated for every quantitative test in your scope
- The method and data source (QC period, levels, EQAS) are documented
- MU is compared with a defined target, and failures have an action plan
- MU is reviewed regularly, and after a change of method, analyzer or reagent
- You can give MU to a doctor who asks for it
Keep the calculation in one controlled spreadsheet or in your software, updated from your QC data, and review it quarterly. Our guides to Westgard rules and EQAS programmes cover the two data sources MU is built on.
Frequently asked questions
Measurement uncertainty is the range around a result within which the true value is expected to lie, usually with about 95% confidence. It combines the lab’s imprecision and bias, and ISO 15189:2022 requires it for every quantitative test.
Take your long-term internal QC CV as imprecision, add bias uncertainty from a reference material or EQAS, combine them as u(c) = √(u(imp)² + u(bias)²), then expand: U = 2 × u(c). Report results as value ± U.
Yes. ISO 15189:2022 clause 7.3.4 requires labs to evaluate and maintain MU for quantitative tests, compare it with performance specifications and review it regularly. NABL assessors check that it’s calculated, documented and reviewed.
That’s a common shortcut when bias is negligible. The fuller method also includes bias uncertainty from reference materials or EQAS. If your method has a significant bias, 2 × CV underestimates your uncertainty.
Review it regularly, typically every quarter or six months as new QC data accumulates, and whenever the method, analyzer, reagent or calibrator changes.
It depends on the target you choose: biological variation specifications, allowable total error limits such as CLIA or RiliBÄK, or clinical requirements. Compare your expanded uncertainty with that target and act if it’s exceeded.
Getting ready for NABL?
Tell us your disciplines and timeline. We’ll show how ClinikPe keeps the records your assessor will ask for.
No setup, migration or training fees · Free trial on cloud plans
Sources
- Singapore Accreditation Council Technical Guide 4: MU in medical testing (Nov 2025)
- ISO 15189:2022 gap analysis (NATA)
- Rigo-Bonnin et al., MU worked examples (Biochem Med 2021)
- MU of 26 analytes at GIPMER Delhi (Indian J Clin Biochem 2022)
- ISO 15189 and NABL practice (J Lab Physicians 2026)
- SADCAS ISO 15189:2022 assessment checklist
Written by the ClinikPe lab operations team in Kolkata. General information, not legal, tax or medical advice; check the sources and your state rules before acting.